Purpose
The Coordinated Entry Model is designed to provide communities a setting for reporting on status and outcomes of their Coordinated Entry System (CES). For information about what defines a Coordinated Entry System, refer to Coordinated Entry and HMIS FAQs on the HUD HMIS portal.
Also, refer to this Clarity Human Services resource available in the Help Center for guidance in setting up Coordinated Entry correctly in alignment with the HUD FY 2020 data standards:
There are two main topics that can be reported from this model:
- Status of the community’s “by name” referral list
- Housing outcomes for households referred through the CES
At the end of this article, there are instructions for creating sample looks for both of these topics.
Organization
The Coordinated Entry model includes the following views specific to this model:
- Assessing Agency - Includes dimensions describing the agency which created the CES assessment for the client
- Corresponds to Data Element 4.19, Coordinated Entry Assessment
- Client Alerts - Includes any alerts an agency has set on a client’s Clarity profile
- Client Assessments (Custom) - A one stop view for all assessment related data.
- Corresponds to Data Element 4.19, Coordinated Entry Assessment
- For use with CES reporting, filter the Look to:
- Is Coordinated Entry Assessment Screen = Yes
- Client Referral Status - includes dimensions describing the client’s referral status within the CES
- Coordinated Entry Event - Includes dimensions to meet the Data Standards for 4.20
- Eligible Programs - Using client demographics and program criteria, these dimensions will return programs where the client is eligible for enrollment
- Enrolling Agencies - includes dimensions describing the agency which accepted a referral for and enrolled a client from the CES
- Program Opening History - includes fields related to historical program opening data (see Program Openings)
- Program Openings - Includes fields related to program openings available for referral
- Referral History - Includes fields related to historical referral data (see referrals)
- Referrals - fields related to a CES Referral including status, dates, and outcomes
- Referto Program - Includes fields related to the program a client has been referred to through the CES process
- Referto Program Openings (Custom) - Includes fields related to openings in the program a client has been referred to
In addition, the model includes the following which are also found in most other client-centered models:
- Client Addresses
- Client Assessments
- Client Contacts
- Clients
- Current Living Situation
- Enrollments
- Enrollment Screen
- Files
- Program Sites
- Programs
- Release of Information
- Service Attendance Dates
- Services
- Staff
- Static Demographics
- Update/Exit Screen
Data Sharing
Data sharing in the CE model is similar to how it is handled in the Client Model, permissions set in Clarity along with Agency sharing settings determine appropriate access to data. Additionally, users are only able to see assessments created by the user's home agency or agencies where they have additional agency access. To see the full Coordinated Entry system, a user must have the appropriate access rights.
Multiple Community Queues and Referrals
In communities where Clarity Human Services is enabled for Multiple Community Queues, "Community Queue Name" will need to be added as a filter to all Looks and Dashboards. This in conjunction with existing Referral dimensions will help identify which Community Queue a client's referral is on.
Sample Looks
Move-in Rate
The strategy for this Look is to use Enrollments in the Coordinated Entry System as the starting point. Next is to look for referrals from the CES that resulted in a Move-In Date.
For this Look to work for your community, the following needs to be in place:
- A screen has been designated as a Coordinated Entry Assessment
- Must be using the referral feature in the Clarity Coordinated Entry System
Model
- Coordinated Entry
Fields
- Custom Measure: Count Enrollments Move-in

- From Count, Enrollments
- Click on the
 , choose "Filter Measure"
 - Change title to "Count Enrollments Move-in"
- Paste in the following to the Measure filter area:
- Click on the
-
-
- is_null(${referrals.referral_enrolling_program_move_in_date_date})=no
-
-
- Save
- Add Count, Enrollments to the data table
- Table Calculation: Rate of Move-in
- From Custom Fields
- Click on New, Table Calculation
- Change the title to "Rate of Move-in"
- Paste in the following to the formula area:
- From Custom Fields
-
-
-
- (${count_enrollments_move_in}/${enrollments.count})*100
-
-
Filters
Add the following filters to the Look:
- Reporting Period Filter, Enrollments is in the past 12 complete months (or other required date range)
- Is Coordinated Entry Assessment Screen, Client Assessments is equal to Yes
- Community Queue Name, Client Referral Status - Required for communities with multiple Community Queues, optional for all others
- Active in Project, Enrollments is equal to No
- Head of Household (Yes/No), Enrollments - is Yes
Visualization
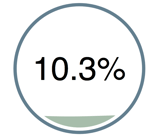
A dynamic way to visualize this Look is using the "Liquid Fuel Gauge Visualization".
- Hide the following from the visualization:
- Count Enrollments Move-in
- Count, Enrollments
- From the Visualizations bar, click on "...", choose "Liquid Fuel Gauge"
Adjust the colors of the visualization as desired using the Edit panel on Visualization.
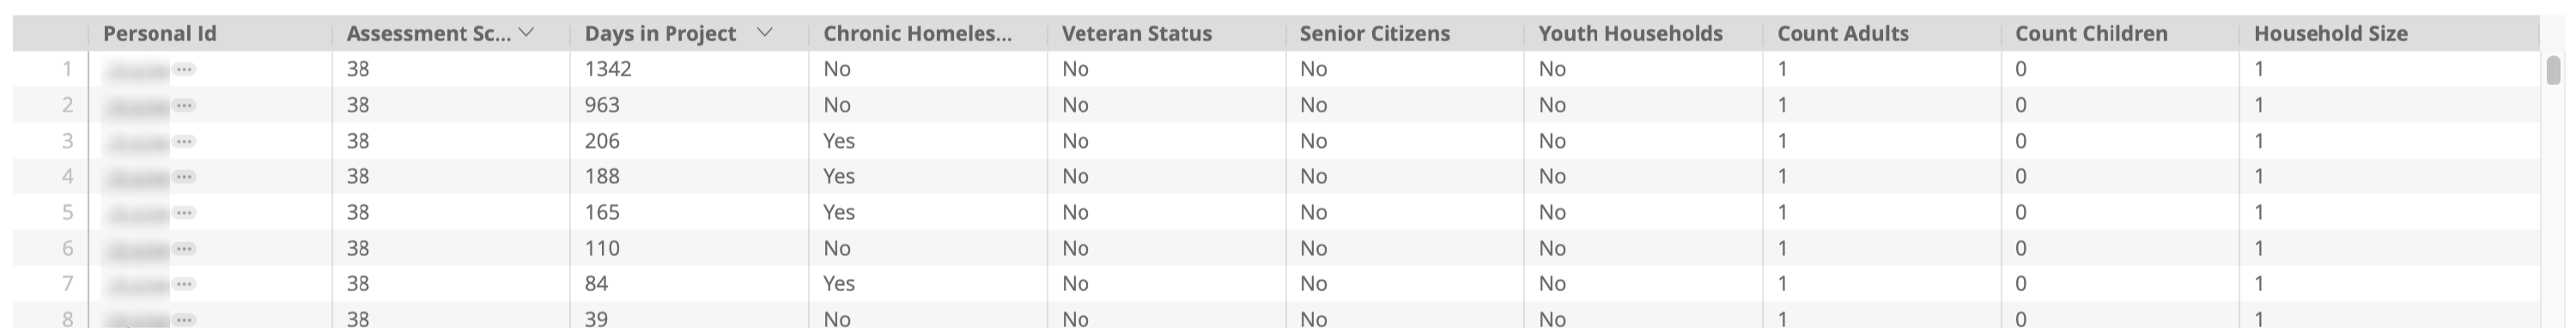
Community By Name List
This Look will provide a simple list of those currently on the Coordinated Assessment Queue, sorted by Assessment Score and the number of days in the CES. The Look also includes filters for some sub-populations.
For this Look to work for your community, the following needs to be in place:
- A screen has been designated as a Coordinated Entry Assessment
- Must be using the referral feature in the Clarity Coordinated Entry System
Model
- Coordinated Entry
Fields
- Personal ID, Clients
- Assessment Score, Client Assessments
- Days in Project, Enrollments
- Chronic Homeless at Project Start, Entry Screen
- Veteran Status, Clients
- Custom Dimension, Senior Citizens
-
- if(${client.age}>=65,"Yes", "No")
- Custom Dimension, Youth Households
- if(${client.age}<=25,"Yes","No")
- Count Adults, Enrollments
- Count Children, Enrollments
- Table Calculation, Household Size
-
- ${household_makeup.count_adults}+${household_makeup.count_children}
Filters
Add the following filters to the Look:
- Is Coordinated Entry Assessment Screen, Client Assessments is equal to Yes
- Is client currently on queue?, Client Referral Status is Yes
- Veteran Status, Clients (optional sub-population filter)
- Head of Household (Yes/No), Enrollments is Yes
- Chronic Homeless at Project Start, Entry Screen (optional sub-population filter)
- Community Queue Name, Referral History (required only for communities with multiple queues)
- Senior Citizens (optional sub-population filter)
- Youth Households (optional sub-population filter)
Visualization
The visualization will default to Table.
- Sort the table by Assessment Score>, in descending order
- Hold down the shift key and sort by Days in Project, in descending order
Updated: 05/08/2023